Memory management in SQL Server has a three-level structure. At the bottom are memory nodes, which are the lowest-level allocators for SQL Server memory. The second level consists of memory clerks, which are used to access the memory nodes, and cache stores, which are used for caching. The top level contains memory objects, which provide a smaller degree of granularity than the memory clerks allow directly.
Only clerks can access memory nodes to allocate memory, so every component that needs to allocate substantial amounts of memory needs to create its own memory clerk when the SQL Server service starts.
1. Memory Nodes
Memory nodes map directly onto NUMA nodes , and you can view details about these nodes on your server using the sys.dm_os_memory_nodes DMV. You will always have at least one memory node, which has a memory_node_id of 0, and you may have several if your CPU architecture supports NUMA.
Each memory node has its own memory clerks and caches, which are distributed evenly across all the nodes (although some objects will only be found in node 0). SQL Server’s total usage is calculated using the sum of all the nodes.
2. Clerks, Caches, and the Buffer Pool
Memory clerks are the mechanism by which memory caches are used, and the buffer pool is by far the largest consumer of memory in SQL Server. All three are discussed in this section.
Memory Clerks
Whenever a memory consumer within SQL Server wants to allocate memory, it needs to go through a memory clerk, rather than going straight to a memory node. There are generic memory clerks like MEMORYCLERK_SQLGENERAL, but any component that needs to allocate significant amounts will have been written to create and use its own memory clerk.
The buffer pool for instance has its own memory clerk (MEMORYCLERK_SQLBUFFERPOOL), as do query plans (MEMORYCLERK_SQLQUERYPLAN), which makes troubleshooting much easier because you can view the memory allocations made by each clerk and see who has what.
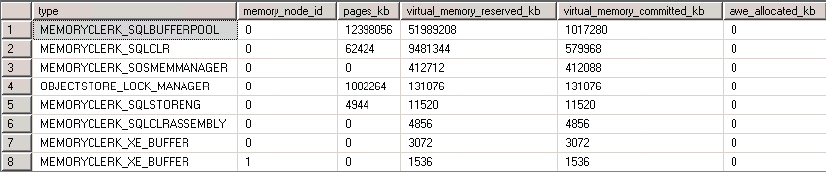
You can view details about all the memory clerks using the sys.dm_os_memory_clerks DMV. For example, running the following query against a SQL Server 2012 Enterprise Edition instance running a production workload produced the results shown in Figure 1:
FIGURE 1
SELECT   [type],
         memory_node_id,
         pages_kb,
         virtual_memory_reserved_kb,
         virtual_memory_committed_kb,
         awe_allocated_kb
FROM     sys.dm_os_memory_clerks
ORDER BY virtual_memory_reserved_kb DESC;
The query orders the results by virtual_memory_reserved_kb, so what you see in the figure are the top eight memory clerks ordered by the amount of VAS that they have reserved.
Caches
SQL Server uses three types of caching mechanism: object store, cache store, and user store.
Object stores are used to cache homogeneous types of stateless data, but it’s the cache and user stores that you’ll come across most often. They are very similar in that they’re both caches — the main difference between them is that user stores must be created with their own storage semantics using the development framework, whereas a cache store implements support for the memory objects mentioned previously to provide a smaller granularity of memory allocation.
Essentially, the user stores are mainly used by different development teams within Microsoft to implement their own specific caches for SQL Server features, so you can treat cache stores and user stores the same way.
To view the different caches implemented on your SQL Server, use the sys.dm_os_memory_cache_counters DMV. For example, running the following query will show you all the caches available, ordered by the total amount of space they consume:
SELECT   [name],
         [type],
         pages_kb,
         entries_count
FROM     sys.dm_os_memory_cache_counters
ORDER BY pages_kb DESC;
Sample output showing the top three caches by size is shown in Figure 2.
FIGURE 2
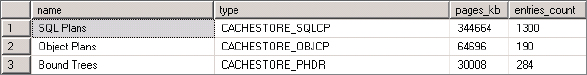
Here, the caches you see are all related to query processing . These specific caches are used for the following:
- CACHESTORE_OBJCP — Compiled plans for objects such as stored procedures, functions, and triggers
- CACHESTORE_SQLCP — Cached plans for SQL statements or batches that aren’t in stored procedures. If your application doesn’t use stored procedures, then the plans are cached here. However, they are much less likely to be reused than stored procedure plans, which can lead to a bloated cache taking a lot of memory .
- CACHESTORE_PHDR — Algebrizer trees for views, constraints, and defaults. An algebrizer tree is the parsed SQL text that resolves table and column names.
Buffer Pool
The buffer pool contains and manages SQL Server’s data cache. Information on its contents can be found in the sys.dm_os_buffer_descriptors DMV. For example, the following query returns the amount of data cache usage per database, in MB:
SELECT   count(*)*8/1024 AS 'Cached Size (MB)'
        ,CASE database_id
         WHEN 32767 THEN 'ResourceDb'
         ELSE db_name(database_id)
         END AS 'Database'
FROM     sys.dm_os_buffer_descriptors
GROUP BY db_name(database_id),database_id
ORDER BY 'Cached Size (MB)' DESC
Monitoring SQL Server’s buffer pool is a great way to look out for memory pressure, and Performance Monitor provides numerous counters to help you do this for quick insight, including the following:
- MSSQL$<instance >:Memory Manager\Total Server Memory (KB) — Indicates the current size of the buffer pool
- MSSQL$<instance >:Memory Manager\Target Server Memory (KB) — Indicates the ideal size for the buffer pool. Total and Target should be almost the same on a server with no memory pressure that has been running for a while. If Total is significantly less than Target, then either the workload hasn’t been sufficient for SQL Server to grow any further or SQL Server cannot grow the buffer pool due to memory pressure, in which case you can investigate further.
- MSSQL$<instance >:Buffer Manager\Page Life Expectancy — Indicates the amount of time, in seconds, that SQL Server expects a page that has been loaded into the buffer pool to remain in cache. Under memory pressure, data pages are flushed from cache far more frequently. Microsoft recommends a minimum of 300 seconds for a good PLE; this threshold continues to be debated within the SQL Server community, but one thing everyone agrees on is that less than 300 seconds is bad. In systems with plenty of physical memory, this will easily reach thousands of seconds.
Plan Cache
Execution plans can be time consuming and resource intensive to create; therefore, it makes sense that if SQL Server has already found a good way to execute a piece of code, it should try to reuse it for subsequent requests. The plan cache (also referred to as the procedure cache) is used to cache all the execution plans in case they can be reused.
You can view the contents of the plan cache and determine its current size by using the sys.dm_exec_cached_plans DMV or by running DBCC MEMORYSTATUS and looking for the “Procedure Cache” section, where you’ll find the number of plans in cache and the cache size, in 8KB pages.
- sys.dm_os_memory_nodes
- sys.dm_os_memory_clerks
- sys.dm_os_memory_objects
- sys.dm_os_memory_cache_counters
- sys.dm_os_memory_pools
The following example script uses sys.dm_exec_cached_plans to show the number of cached plans and the total size in MB:
SELECT count(*) AS 'Number of Plans',
sum(cast(size_in_bytes AS BIGINT))/1024/1024 AS 'Plan Cache Size (MB)'
FROM sys.dm_exec_cached_plans
Running this on a production SQL Server 2012 instance with Max Server Memory set to 32GB produced the following results:
Number of Plans   Plan Cache Size (MB)
14402 2859- 75% of server memory from 0–4GB +
- 10% of server memory from 4GB–64GB +
- 5% of server memory > 64GB
Therefore, a system with 32GB of RAM would have a maximum plan cache of 3GB + 2.8GB = 5.8GB.
Query/Workspace Memory
In SQL Server, query memory (also known as workspace memory) is used to temporarily store results during hash and sort operations when executing a query. It’s not very widely known or documented, but if you look at an execution plan (also known as an query plan) for a query and you see hash and/or sort operators, that query needs to use query memory to complete execution.
Query memory is allocated out of the buffer pool, so it’s definitely something to be aware of when you’re building a picture of the memory usage on a server.
You can find out how much query memory an individual query uses by looking at the properties of an actual execution plan in Management Studio, as opposed to an estimated execution plan. The estimated plan contains information about how SQL Server will run the query, and it shows any hash or sort operators; but the actual plan reflects what SQL Server used to execute the query, and it contains additional runtime data, including how much query memory was used.
You can view the details of any queries that already have an allocation of query memory (memory grant) and those that are waiting for a memory grant using the sys.dm_exec_query_memory_grants DMV.
Query memory also has its own memory clerk, which means you can view the sizing information for outstanding memory grants by querying the sys.dm_exec_query_memory_grants DMV where type = ’MEMORYCLERK_SQLQERESERVATIONS’.
The memory requirements for all hash and sort operators in a plan are added together to get the total query memory requirement.
The amount of space available as query memory is dynamically managed between 25% and 75% of the buffer pool but it can grow larger than that if the buffer pool is not under pressure.
Five percent of query memory is reserved for small queries that require less than 5MB of memory and have a “cost” of less than 3. SQL Server assigns a cost to queries based on how many resources will be needed to run the query.
No individual query will get a grant for more than 20% of the total query memory, to ensure that other queries can still be executed. In addition to this safeguard, SQL Server also implements a query memory grant queue. Every query that contains a hash or sort operation has to pass through the global query memory grant queue before executing, which is organized as five queues organized by query cost query cost.
Each query is put into the appropriate queue based on cost, and each queue implements a first-come first-served policy. This method enables smaller queries with lower memory requirements to be processed even if larger queries are waiting for enough free memory.
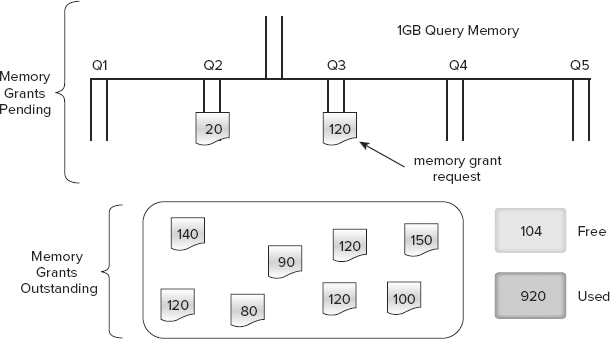
Figure 3 shows a representation of the five queues based on query cost that make up the global memory grant queue on a server with 1GB of query memory. The box at the bottom of the picture contains eight existing memory grants totaling 920MB, leaving 104MB free. The first request to arrive was for 120MB and went into Q3. This request can’t be allocated immediately because only 104MB are free. The next request is only for 20MB and goes into Q2. This request can be fulfilled immediately because having multiple queues means that it isn’t stuck behind the first request that is still waiting.
FIGURE 3
The Query Wait Option
Queries can time out if they spend too much time waiting for a memory grant. The time-out duration is controlled by the Query Wait option, which can be modified either using sp_configure or on the Advanced page of Server Properties in Management Studio. The default value is -1, which equates to 25 times the cost of the query, in seconds. Any positive value for Query Wait will be used as the time-out value in seconds.
It is possible for a transaction that contains a query waiting for a memory grant to hold locks open and cause a blocking problem before it times out. In this situation, a lower Query Wait value would reduce the impact on other tasks by causing the query to time out sooner.
However, first try to reduce the memory requirement for the query or increase the available memory to avoid the timeout before changing a global option like Query Wait because doing so affects all queries running on the server. The default setting allows for a dynamic time-out value that varies according to the query cost, so it’s generally the best option.
Query Memory Diagnostics
There are a number of different ways to get information on query memory usage on your SQL Server in addition to the DMVs already discussed at the beginning of the section. Performance Monitor provides the following counters, all of which are found within the instance’s Memory Manager:
- Granted Workspace Memory (KB) — Total amount of query memory currently in use
- Maximum Workspace Memory (KB) — Total amount of memory that SQL Server has marked for query memory
- Memory Grants Pending — Number of memory grants waiting in the queue
- Memory Grants Outstanding — Number of memory grants currently in use
The RESOURCE_SEMAPHORE wait type is a wait on a memory grant, so if you see this near the top in your results from the sys.dm_os_wait_stats DMV, then your system is struggling to provide memory grants fast enough.
You can also encounter performance issues other than just a query timing out while it waits for a memory grant. Within an execution plan or when analyzing a SQL trace, you may notice hash warning or sort warning messages if you have selected the relevant events. These occur when the memory grant was insufficient for a query’s requirements.
A hash warning occurs when the hash build doesn’t fit in memory and must be spilled to disk (its actually written to tempdb). A sort warning occurs when a multi-pass sort is required because the granted memory was insufficient. Both warnings generally occur because the SQL Server Query Optimizer made the wrong choice, usually because of inaccurate statistics or a lack of useful statistics.