Communication and reporting are significant parts of what a project manager does, particularly during the planning and execution stages of a project. Learning how to enhance your schedule for presentations, reports, and email will help ensure your success. You can take advantage of the formatting tools available in Project to create higher-impact communication.
1. Formatting Text Styles
A Gantt chart consists of two separate parts on the screen. On the left is the text area, which contains the table of built-in or custom fields. On the right are the Gantt bars. You can format both sides to suit your needs.
1.1. One Line Item at a Time
In the text area, you can format one line item at a time. To change the look and feel of one item (or selected items), follow these steps (see Figure 1):
-
Go to Task tab => Font group.
-
Apply the appropriate font options.
Figure 1. Formatting text for specific line items
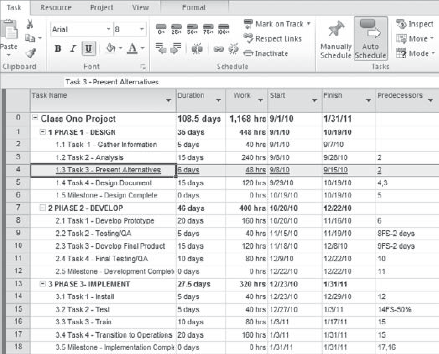
Figure 1 shows only one task highlighted in yellow and underlined. This allows you to call attention to that specific task. In this case, it highlights the fact that this task is coming up and that appropriate stakeholders should be aware of it. You can use this approach for both task-type views and resource-type views.
1.2. View-Wide Text Formatting
You may want to enhance the appearance of your schedule by making view-wide changes. For example, perhaps you want to call out the appearance of milestones, critical tasks, or summary tasks for the entire view and not just one task at a time. You can accomplish this by taking advantage of the Text Styles command, as shown in Figure 2, by following these steps:
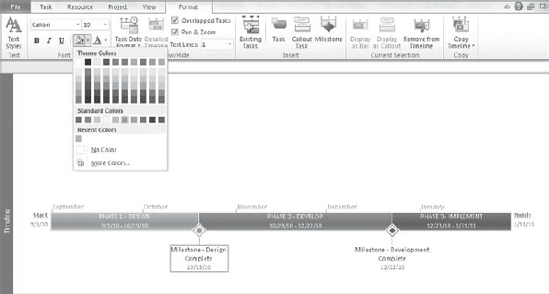
Figure 2. Applying view-wide formats with text styles
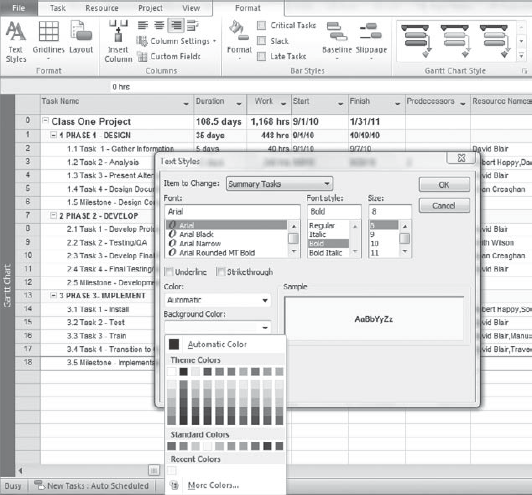
Figure 2 shows the selection for summary tasks with a background color of light yellow.
The text formats you select are view-specific. As you switch from one view to another, the formatted text changes as well. This makes it even more valuable to create custom views so you can apply custom text formatting to suit the needs of different stakeholders in each view without having to reformat each time.
2. Formatting Bar Styles
Formatting the look and feel of the Gantt bar area is also very useful. You can modify the look and feel of summary tasks, tasks, and milestones, including attributes such as progress lines for percent complete, delay lines, and so on. Not only can you change the appearance of the bar, but you can also add text around the bar. Any of the fields available to be added to a table is also available to be added on top of, below, to the right of, to the left of, or inside a bar. This allows for richer communication of schedules.
2.1. Formatting One Bar at a Time
Just as in the text area, you can choose to format one bar at a time or make view-wide changes to your Gantt bars. Sometimes you may want to focus on one task or one milestone and change its look and feel either by changing the color or by adding text around it.
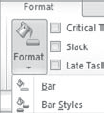
Figure 3 shows the two choices you have when formatting bars. Bar applies format changes only to the specific line item or items you’ve selected, and Bar Styles makes view-wide changes to all the bars in the Gantt Chart view.
Figure 3. Accessing format bar styles
To make changes to one bar, follow these steps:
-
In the Gantt Chart view, select Format tab => Bar Styles group => Format => Bar.
-
Choose the appropriate shape, type, or color.
-
Click OK.
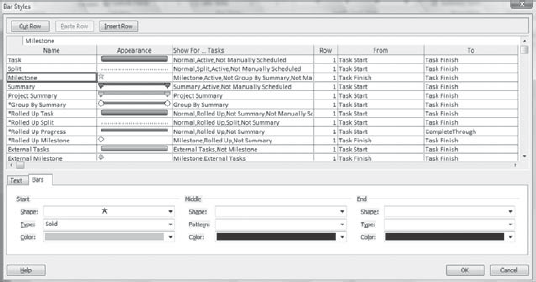
After you select the Format Bar option, you can choose the appropriate settings and style for that specific item or selected items. The example in Figure 4 shows the single selected milestone formatted with a different shape and a different color.
2.2. View-Wide Bar Format Changes (Including Adding Text)
You can also make view-wide changes to the look and feel of the Gantt bars by selecting Bar Styles from the Format list:
-
Click OK.
Figure 4. Formatting bar styles, shapes, and text
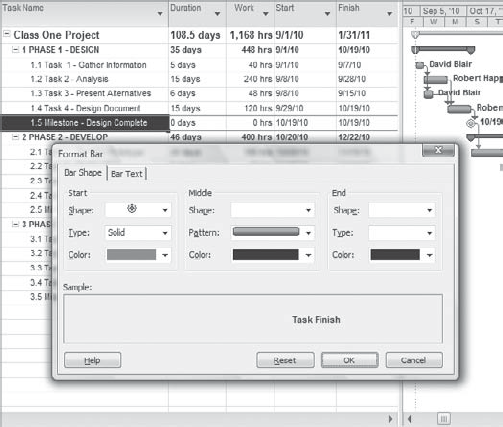
As shown in Figure 5, you can now make view-wide changes to the way bars are displayed in the Gantt view. For example, if you click Milestone and change the shape and color, the change affects all the milestones in the chart.
Figure 5. View-wide format changes to bar styles
Using this approach, you can make view-wide changes to your Gantt bar area for any type of item or line that appears in the chart. You can also add text to your bar area, applying it to any of the fields that are available for a table. To do so, click the Text tab in the Bar Styles dialog box. You can then add text above, to the right of, to the left of, below, or inside a bar by selecting from the drop-down list. Figure 6 is an example of a modified Gantt bar based on applying text fields in the bar area.
Figure 6. Adding text to bars
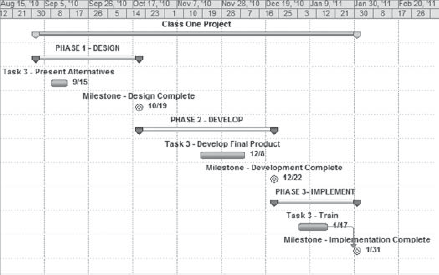
Figure 6 shows the Name field on top and the finish date to the right of the tasks, milestones, and summary tasks, including the project summary. This makes for another effective way to communicate a project schedule.
2.3. Formatting the Timeline View
The Timeline view is a concise roll-up of the entire project into one bar that can be easily formatted and shared . Because it’s such a powerful communication tool, it’s worthwhile reviewing the unique formatting options available. As with the Gantt chart, you can apply specific formats to enhance your communication.
By default, the Timeline view appears on top of the Gantt chart. You can turn the Timeline view on or off as follows:
You can also add tasks or milestones to the timeline by right-clicking an item in the Gantt chart table and clicking Add to Timeline. You can remove items in a similar fashion.
After items are added to your Timeline view, you can format the items and the timeline bar itself for more effective communication. You can also display only the Timeline view without the Gantt chart by following these steps:
-
Go to Task tab => View group, and click the Gantt Chart button.
-
From the list, select Timeline.
The Timeline view displays by itself, ready for additional formatting, as shown in Figure 7.
Figure 7. Formatting the Timeline view
To format the Timeline view, click the Format tab, remembering that the format tools are different depending on which view is applied. In this case, you can use each of the group areas to modify the Timeline view in different ways. For example, you can change the font or color of a task or milestone by selecting it in the view and using the tools in the Font group or clicking the Text Styles command in the Text group to make view-wide changes to the text.
You can also add line items to or delete them from the Timeline view as shown in Figure 8, by following these steps:
Figure 8 adds to the view not only the milestones but also the three main summary tasks, which you can see in Figure 7. You’re now free to format each of these items for more effective presentations.
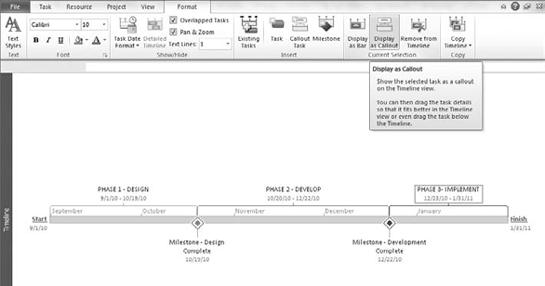
You can also take a task or summary task that you’ve added to your timeline and make it a callout instead of embedding it in the timeline bar. Figure 9 illustrates using callouts for the summary tasks. To create a callout, follow these steps:
-
Go to Format tab => Current Selection group, and click Display as Callout.
You can format the callout names by either using the Text Styles option for view-wide changes or using the Font group for individual item changes.
Figure 8. Adding items to or deleting them from the Timeline view
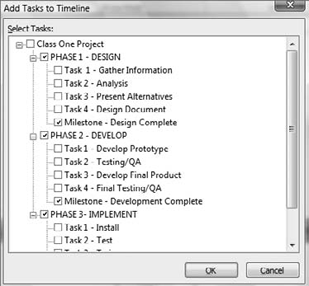
Figure 9. Adding a callout to the Timeline view
When you’re ready to share the Timeline view, right-click, as shown in Figure 10, and select For E-Mail, For Presentation, or Full Size. You can also follow these steps:
-
Select For E-Mail, For Presentation, or Full Size.
-
In the target application (for example, Outlook or PowerPoint), select Paste.
Figure 10. Sharing the Timeline view
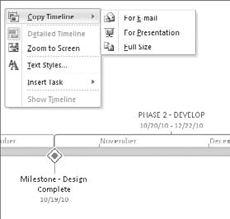
Figure 11 is an example of what it looks like if you paste a copy of the Timeline view into an e-mail.
Figure 11. Timeline View in an e-mail
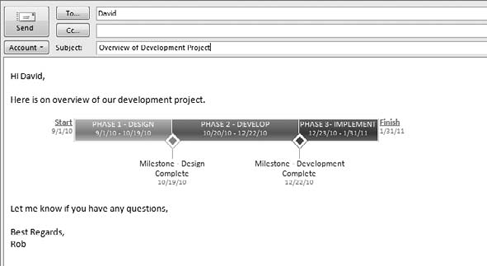
As you can see, the Format tab in the Timeline view lets you share project information with stakeholders more effectively.