For decades, computer programmers have been utilizing flowcharts to illustrate the relational flow of data in processes. A flowchart is a systematic graphical representation employing diverse symbols, arrows and short descriptions of the process steps. Just like the blueprint of a building, programmers construct flowcharts to analyze, design, document and manage a program development phase. A programmer can forge his flowchart in various applications like MS Word, PowerPoint Templates or use any online software like SmartDraw and Edraw.
The merits of harnessing an exceptional flowchart in programming are multitude. Along with visualized documentation of a complex program, some benefits of flowcharts are:
- Facilitates communication between programmers and other people involved in the process
- Vital role in comprehending the logic of a complicated program
- Quick aid to formulate programs in a high-level language
- Accounting of input, process and output for intelligible analysis
- Decipher potential problem areas to assist in debugging
- Simpler to understand than algorithms and pseudo codes
- Smooth maintenance of operating program
- Efficient coding and data management
Flowcharts are incredible to clarify the working of complex codes and processes. Every computer programmer should trace a flowchart before the beginning of a project to plan it seamlessly. Draw a perfect flowchart with symbols like the terminator, process, decision, data, connector, delay, arrows and flowlines. This article will list varied flow charts feasible for programmers to sketch their flawless flowchart.
Here are 7 types of lucrative flowcharts for programmers:
Cross-Functional Flowchart
Cross-Functional flowcharts also known as Deployment flowcharts are employed when the programmers want to highlight the relationship as to who and what process is reliable for each step of the process. When multiple stakeholders, departments and operational units are involved in a process, it becomes difficult to visually manage them without a flowchart.
This flowchart exhibits a detailed algorithm of the business process execution and the interaction between the data and variables. Using swimlanes representing functional units, it can be horizontal, grid-like or vertical. They are simple and easy to create with a meticulous focus on the work done by all employees and managers. It depicts the visualizations of functional units smoothly and efficiently.
Swim Lane Flowchart
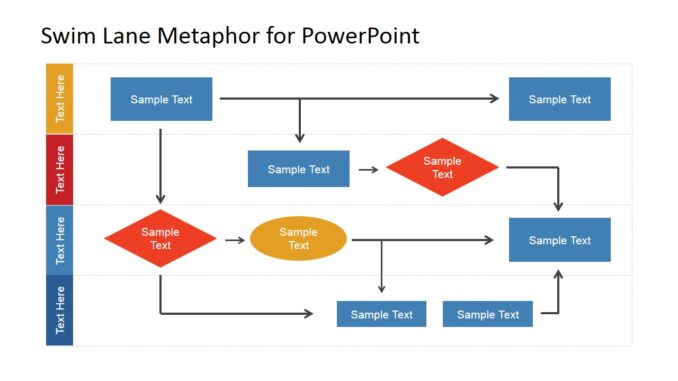
Swim Lane flowchart are process flow diagrams that are quite identical to the cross-functional flowchart employing a large collection of lanes for programmers to stay on the track. This flow chart demonstrates the responsibility of people involved or the processes in the conversion of input to output at each point.
Parallel lines are used to divide the chart into lanes, designating each lane to a sub-process. Without this flowchart, the software development process can quickly sidetrack and get haphazard with multiple participants and concurrent activities. This can lead to undetected bugs and other errors which can cost you a client loss. Swim lanes are excellent to illustrate the functional responsibilities of each person in the business.
Influence Diagram
Influence diagrams are an intuitive visual tool in the decision-making process. It showcases the decisions, uncertainties and objectives in nodes of diverse shapes and colors. Arrows are used to illuminate the influences. They are advantageous to grasp the relationships and dependencies among the variables in a situation. They are hierarchical and best alternatives to decision trees.
Every core decision of business has influences acting upon them. Questions like what to produce and sell, the target market, budgeting and pricing models can be pictured in the influence Flowchart templates. Assess the decisions, chance variables, objectives and final valuation qualitatively with this highly conceptualized model.
Specification And Description Language Flowchart (SDL)
Specifications and Description Language (SDL) is a specification language crafting specifications, data, representation of behavior deployed in real-time, stimulus-response systems. It is often used in telecommunications, automotive and aviation industries. With this flowchart, computer algorithms are brainstormed using a unique set of symbols to map out real-time systems.
The three basic elements of an SDL diagram are system definition, the block and the process. This flowchart is critical in programming and network designing as it contributes to internal problem-solving. These flowcharts being visually easy to follow are effective in showing how to troubleshoot common problems to the customers.
Data Flow Diagram
A Data Flow Diagram (DFD) is a structural analysis and construction of information processes. It graphically represents the flow of information based on inputs and outputs. This specialized flowchart incorporates a few symbols and connectors used by analysts to examine the functional requirements of a business or programming.
Its broad application in data management is favored in software development projects. Exploiting the technique of top-down expansion, this flowchart analyses the overall picture of the business or the program. DFD is a precursor to business process re-engineering and refinement in existing business schedules. Programmers can benefit from this diagram as it holistically presents all the channels of data input and output.
System Flowchart
System flowcharts show the data flow throughout a system symbolically upon which event-controlling decisions are taken. This flowchart is ideal to determine the flow of data through operations like data entry, software programs, communication networks and microcontrollers.
Using symbols disks, tapes, terminal input and output, this flowchart shows the various points of data in the system and how they interact with each other. System flowcharts are quite similar to data flow diagrams using lines with arrowheads indicating the flow of data. They illustrate the major processes of a program and can describe the mechanism involved in working systems.
Process Flowchart
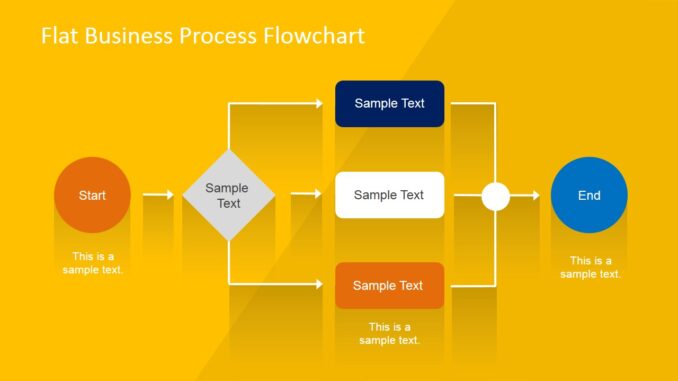
Process Flowcharts are the most basic diagrams to map out new projects frequently used by engineers and software designers. But, since they describe the process of a project they are used widely in every niche. They define the step-by-step execution of an algorithm using arrows that show the order of operations. Systematic decisions can be made by understanding the proper process of the programs.
They are implemented in analyzing, designing, documenting and managing a process. Corporations and businesses globally can maneuver the process flowcharts to implement optimum efficiency in the business processes. An extensive process diagram can guide the programmers and businesspersons to spotlight bottlenecks and highlight process incapabilities.
Program Flowchart
Program flowcharts are incorporated with symbols depicting a sequence of coded instructions. They often visualize the internal working of a computerized system. Four basic symbols of start, process, decision and end are utilized to construct a modern program flowchart. They are of great utility to software developers to identify bugs inside a computer code. They improve coding efficiency as well.
Flowcharts are accomplished and impressive tools to visualize the data and processes. They facilitate the informational flow and help to modify the identified problems. Flowcharts with their pictorial nature simplify the complicated data which the layman might find difficult to fathom. The programmer can administer effective analysis on the encoded syntax and check to see if any instruction is left. These flowcharts serve as exemplary means of communication for people of every vocation.