Without a way to monitor the execution of the implemented application logic, you would implement features almost blindly with regard to performance. Fortunately, the Dynamics AX development environment contains a set of easy-to-use tools to help you monitor client/server calls, database activity, and application logic. These tools provide good feedback on the feature being monitored. The feedback is integrated directly with the development environment, making it possible for you to jump directly to the relevant X++ code.
1. Dynamics AX Trace Parser
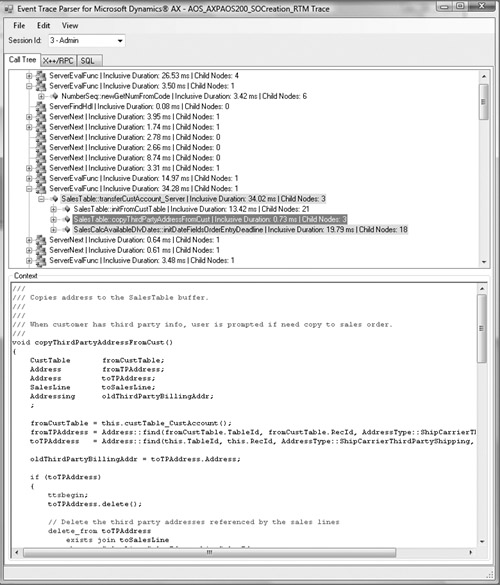
The Dynamics AX Trace Parser is a user interface and data analyzer added to Dynamics AX 2009 and built on top of SQL Server 2005 and SQL Server 2008 and the Event Tracing for Windows (ETW) framework enabled in the core Dynamics AX kernel. The Event Tracing for Windows framework allows an administrator to conduct tracing with system overhead of approximately 4 percent. This low overhead allows administrators to diagnose performance problems in live environments as opposed to just development environments.
The Trace Parser enables rapid analysis of traces to find the longest-running code, longest-running SQL query, highest call count, and other metrics useful in debugging a performance problem. In addition, it provides a call tree of the code that was executed, allowing you to quickly gain insight into unfamiliar code. It also provides the ability to jump from the search feature to the call tree so that the person analyzing the trace can determine how the problematic code was called.
The Dynamics AX Trace Parser is available as a free download from Partner Source and Customer Source.
2. Setting Tracing Options
Dynamics AX Tracing provides multiple locations where you can set tracing options for server and client activity:
-
In the Microsoft Dynamics AX Server Configuration Utility, on the computer running the AOS instance.
-
In the Microsoft Dynamics AX Configuration Utility, on a client.
-
Within Dynamics AX, in the Tools\Options dialog box, on the Development and SQL tabs.
The following procedures describe how to set tracing options in the AOS and the Dynamics AX client.
Note
Setting Tracing Options on the AOS
|
1.
|
Open the Microsoft Dynamics AX Server Configuration Utility (Start\Administrative Tools\Microsoft Dynamics AX 2009 Server Configuration Utility).
|
|
2.
|
Verify that the currently selected AOS instance and configuration are the ones you want to modify.
|
|
3.
|
On the Tracing tab, choose Options, and click Start Trace. If the AOS service is running, the trace starts within 15 seconds. If the service is stopped, the trace starts the next time the service is started.
|
Setting Tracing Options on the Client
|
1.
|
Open the Microsoft Dynamics AX Server Configuration Utility (Start\Control Panel\Administrative Tools\Microsoft Dynamics AX Configuration Utility).
|
|
2.
|
Verify that the currently selected configuration is the one you want to modify.
|
|
3.
|
On the Tracing tab, evaluate the type of tracing you need to do, and choose Settings.
|
|
4.
|
To start tracing once you’ve set the options you want, close the utility and restart your Dynamics AX client.
|
3. Tracing Options and Other Tracing Activities
The tracing options in the configuration utilities are described in Table 1. Later in this section, we cover additional tracing information you need to know, such as troubleshooting common tracing problems and importing and analyzing traces.
| Tracing Option | Description |
|---|---|
| RPC round-trips to server | Traces all RPC round-trips from any client to the server |
| X++ method calls | Traces all X++ methods that are invoked on the server |
| Number of nested calls | Limits tracing to the specified number of nested method calls |
| Function calls | Traces all function calls that are invoked on the server |
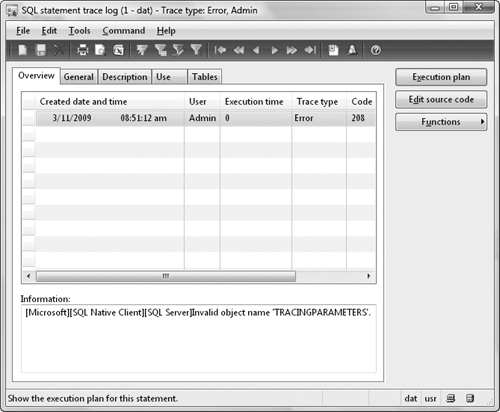
| SQL statements | Traces all SQL Server statements that are invoked on the server |
| Bind variables | Traces all columns that are used as input bind variables |
| Row fetch | Traces all rows that are fetched using SQL Server |
| Row fetch summary (count and time) | Counts all rows that are fetched, and records the time spent fetching |
| Connect and disconnect | Traces each time the AOS connects and disconnects from the database |
| Transactions: ttsBegin, ttsCommit, ttsAbort | Traces all transactions that use the TTSBegin, TTSCommit, and TTSAbort statements |
Files from traces are saved to the locations described in Table 2.
| Type of Trace | Location |
|---|---|
| AOS trace files | AOS computer log\<servername>_<timestamp>.trc |
| AOS settings and SQL Settings triggered from the client (Allow Client Tracing On Application Object Server Instance is selected.) | AOS computerusername>_<clientIP>_<sessionID>_<server>.trc log\< |
| Client method trace triggered from the client (Enable Method Tracing To Client Desktop is selected.) | Client computer log \<username>_<clientIP>_<sessionID>_<client>. trc |
A new file is created each time tracing is started or at the start of each new day. If you’re running frequent traces, be sure to remove or archive unneeded trace files often.
The default trace buffer settings in Dynamics AX 2009 are not optimal for collecting traces and can lead to dropped events. Dropping events leaves much of the trace file unusable. We recommend that you set values for the following registry settings for the AOS: (HKEY_LOCAL_MACHINE\SYSTEM\CurrentControlSet\Services\Dynamics Server\5.0\01\ Configurationname):
-
tracebuffersize = 512
-
traceminbuffers = 30
-
tracemaxbuffers = 120
Troubleshooting Tracing
In this section, we provide information on how to troubleshoot the two most common issues you encounter while tracing.
Sometimes a trace that appears to be running in the configuration utility doesn’t look like it’s running in Windows. Here’s why: When a trace file reaches its size limit, Windows stops the trace. The configuration utility interface doesn’t synchronize with Windows until Stop Trace is clicked. Additionally, the Event Tracing for Windows framework drops the trace and the trace events when the disk has insufficient space. So make sure that there is more free space than the value set in tracemaxfilesize in the registry.
If you run more than one client-tracing session simultaneously, don’t be surprised when your system slows down. Tracing is processing intensive and space intensive. We recommend that you don’t turn on tracing for more than one client at a time.
Importing Traces
You can import traces collected on either the client or the server by downloading the Dynamics AX Trace Parser. Detailed documentation for importing traces is available with the tool.
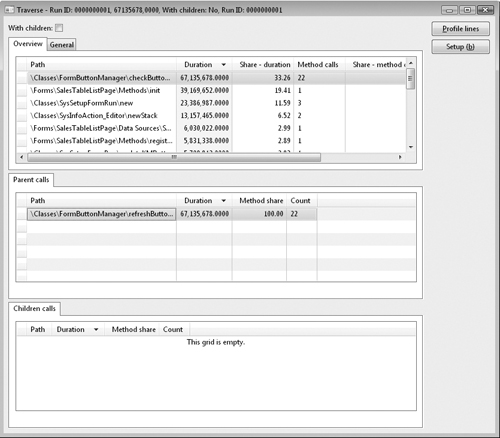
Analyzing Traces
Once you load the trace files into the Trace Parser, they are available with ready-made analysis views. Figure 1 shows the Open Trace Database view.
Figure 1. Trace listings view

When you open a trace from the trace listings view, you see a summary view with many search capabilities and an integrated view of the code as the call tree is analyzed.

Dynamics AX 2009 Monitoring Tools (part 2) – Monitoring Database Activity
Dynamics AX 2009 Monitoring Tools (part 3) – Code Profiler Tool