3. Monitoring Client/Server Calls
When you develop and test a Dynamics AX application, you can monitor the client and server calls by turning on the Client/Server Trace option, found on the Development tab in the Options dialog box, which can be accessed from the Tools menu. The Development tab shows the calls made that force the application runtime to parse from one tier to the other. Figure 3 shows an example of the client/server trace for one of the previous X++ examples.
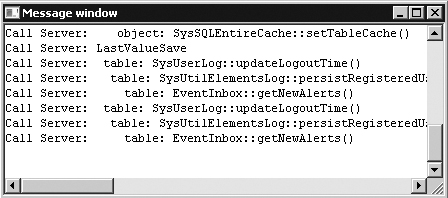
Figure 3. Client/server trace message window
4. Monitoring Database Activity
You can also trace database activity when you’re developing and testing the Dynamics AX application logic. You can enable tracing on the SQL tab in the Options dialog box. You can trace all SQL statements or just the long queries, warnings, and deadlocks. SQL statements can be traced to the Infolog, a message window, a database table, or a file. If statements are traced to the Infolog, you can use the context menu to open the statement in the SQL Trace dialog box, in which you can view the entire statement as well as the path to the method that executed the statement. The SQL Trace dialog box is shown in Figure 4.
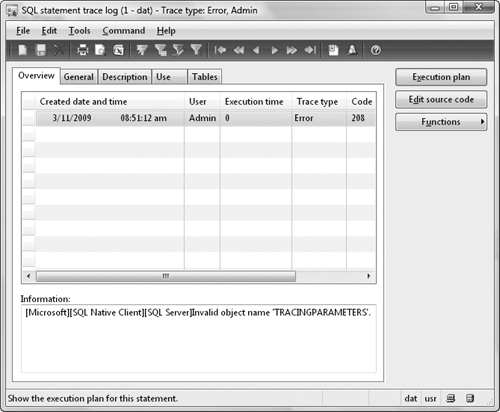
Figure 4. SQL Trace dialog box
You can open the Statement Execution Plan dialog box from the SQL Trace dialog box, as shown in Figure 5. This dialog box shows a simple view of the execution plan to help you understand how the the underlying database will execute the statement.
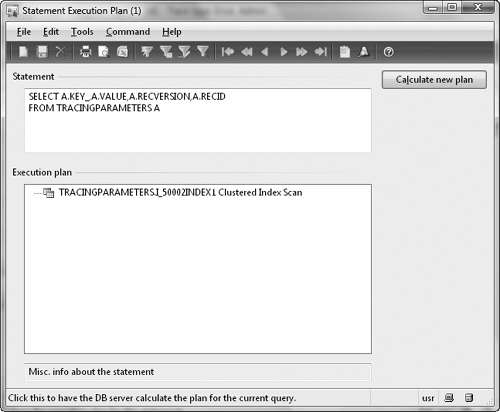
Figure 5. Statement Execution Plan dialog box
Important
|
To trace SQL statements, you must select the Allow Client Tracing On Application Object Server Instance option on the Tracing tab in the Microsoft Dynamics AX Server Configuration Utility. |
From either the SQL Trace or the Statement Execution Plan dialog box, you can copy the statement and, if you’re using SQL Server 2005, paste it into SQL Server Query Analyzer to get a more detailed view of the execution plan. In SQL Server 2008, open a new Query window in SQL Server Management Studio and paste in the query. If the Dynamics AX application runtime uses placeholders to execute the statement, the placeholders are shown as question marks in the statement. These must be replaced by variables or constants before they can be executed in the SQL Server Query Analyzer. If the application runtime uses literals, the statement can be pasted directly into the SQL Server Query Analyzer and executed.
When you trace SQL statements in Dynamics AX, the application runtime displays only the DML statement. It doesn’t display other commands sent to the database, such as transaction commits or isolation level changes. With SQL Server 2008, you can use the SQL Server Profiler to trace these statements using the event classes RPC:Completed and SP: StmtCompleted in the Stored Procedures collection, and the SQL:BatchCompleted event in the TSQL collection, as shown in Figure 6.
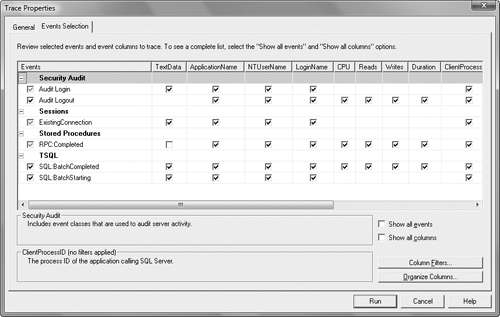
Figure 6. SQL Server Profiler trace events
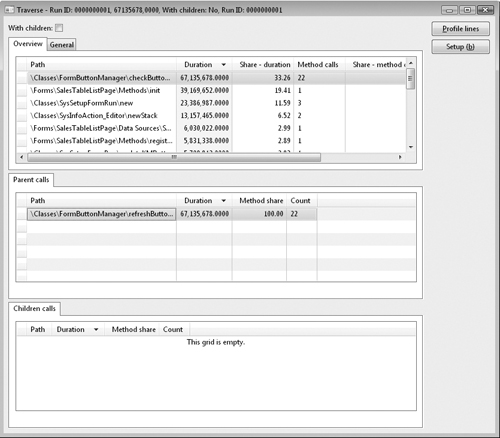
Dynamics AX 2009 Monitoring Tools (part 3) – Code Profiler Tool