Visio 2010 includes five completed sample drawings that you can use as the basis for creating a drawing of your own. Each sample diagram contains shapes, text, and data on one or more pages.
In this exercise, you will create a new drawing from one of the Visio 2010 sample diagrams.
Note:
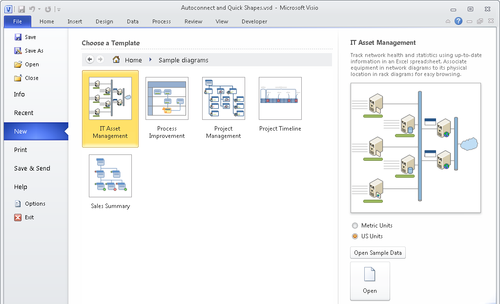
Click the File tab, and then click New.
-
In the Other Ways to Get Started section, click Sample diagrams.
In the center panel, you see the name and preview image of the five sample diagrams. The right panel displays additional information about the selected sample diagram and provides evidence of the underlying data in the form of a button labeled Open Sample Data. Clicking that button launches Excel and displays the data for the selected diagram
-
Double-click the IT Asset Management thumbnail.
The sample diagram opens. Notice that the title of the Visio window is not IT Asset Management but is Drawing1 (or Drawing followed by another number if you have created other new drawings during the same Visio session). Visio has not opened the sample document but has created a new diagram from it.
External Data Window 

-
If you are running Visio Professional or Premium and see the External Data window, on the Data tab, in the Show/Hide group, click the External Data Window button to close it. If you are running Visio Standard, the External Data window does not appear.
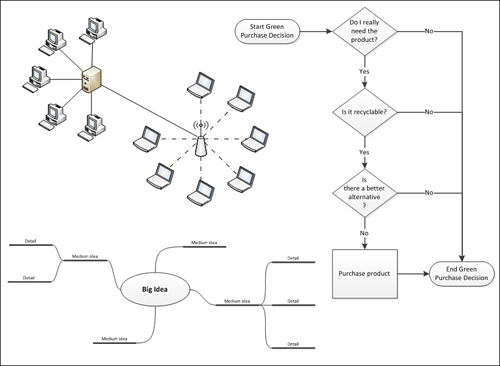
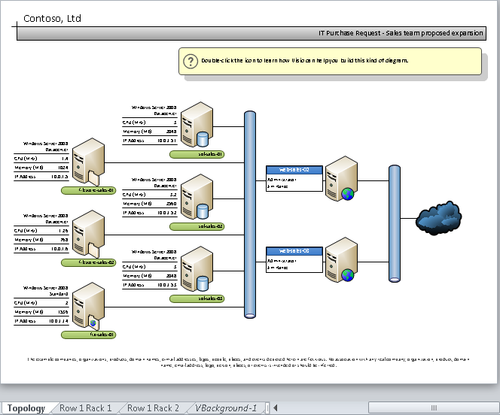
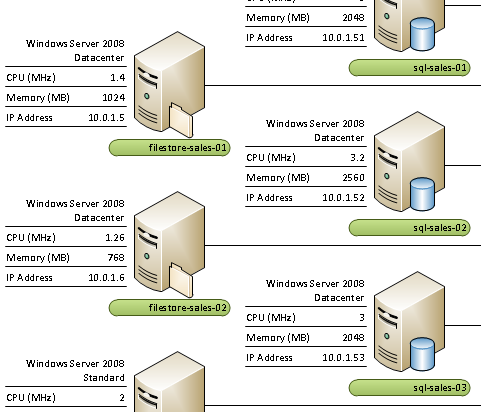
The first page of the sample diagram shows the network topology for Contoso, Ltd. The page name tabs below the drawing window indicate that there are three additional pages in the drawing.
Tip:
The data you see displayed under and on the left of the server shapes in this and the following graphics is displayed by Visio data graphics.
-
Zoom in on the left half of the page.
Each server is pictured with an icon representing the server type and also displays data about the server.
-
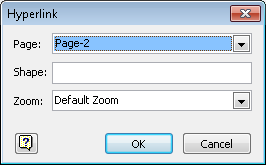
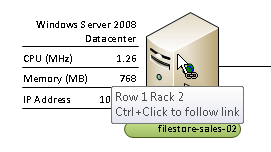
Point to filestore-sales-02 on the left side of the diagram.
The cursor displays a hyperlink indicator attachment, and the pop-up text displays the name of the hyperlink target—in this case, a page name and the instructions “Ctrl+Click to follow link”.
-
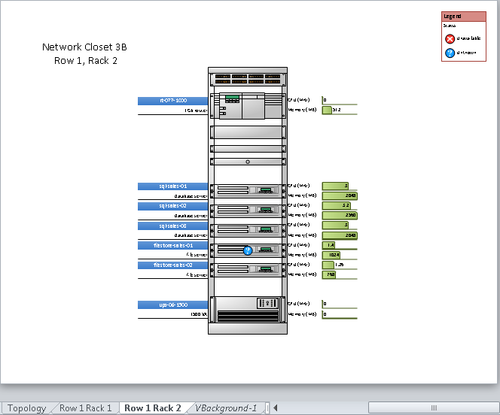
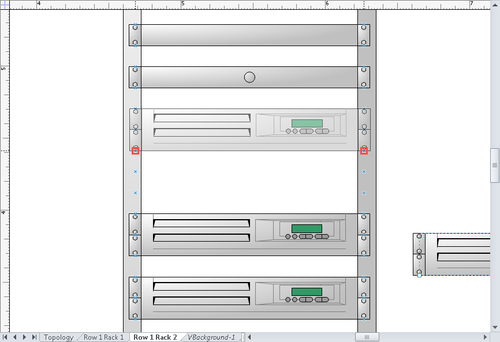
While pressing the Ctrl key, click the server shape to follow the hyperlink. Visio displays page Row 1 Rack 2 with its representation of the rack containing server filestore-sales-02.

-
Zoom in to explore the rack diagram, and then click once to select the rack shape for filestore-sales-02.
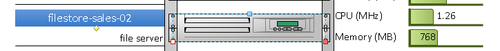
If you look at the shape in the rack on your screen or in the previous graphic, you see that it displays those symbols: a white square with a red outline on the left and a solid red square on the right. Despite the fact that it looks like a 2-D shape, the server is really a 1-D shape!
The server was designed as a 1-D shape so it would snap into the equipment rack, which was created with a series of connection points along both vertical side pieces (the connection points are visible in the following graphic). If you explore the network and computer stencils, you’ll find a large number of shapes that appear to be 2-D shapes but that are actually 1-D shapes for this reason.
Note:
Save your diagram as Network Map, and then close the file.
In addition to creating a new drawing from one of the five sample drawings provided with Visio, the 2010 version also lets you create a new drawing from any existing drawing. This enables you to create a drawing by starting with existing content, knowing that any changes you make will not affect the original drawing.