SQL Profiler is not necessarily a SharePoint Administrator’s tool. It is associated with the Database Administrator. However, due to SharePoint’s reliance on SQL Server, it is important that an administrator understand the tool and its use.
SQL Profiler is a tool that captures every event going to SQL and saves the information in a trace file. Using the built-in recorder, the administrator can capture information and then stop when enough has been collected.
This information can be critical to debugging and performance tuning. With SQL Profiler, you can monitor SQL statements and stored procedures, slow performance, and audit and review activities.
This recipe shows how to instantiate SQL Profiler against SharePoint 2010.
Getting ready
You must have administrator permissions to connect to a specific instance of SQL Server and have permissions to execute Profiler stored procedures. You must have SQL Server Client Tools loaded to your machine.
How to do it…
-
Select Start | All Programs | Microsoft SQL Server 2008.
-
Select Performance Tools | SQL Server Profiler.
-
Select File | New Trace.
-
Select the server name and click Connect.
-
The following dialog appears:
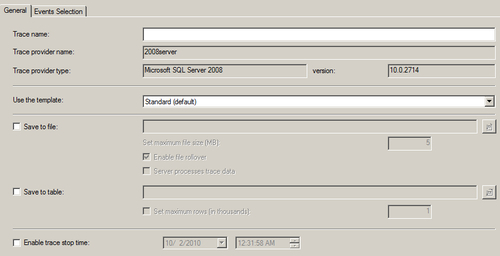
Fill in the required information.
-
Trace Name: SPTrace.
-
Use the template: Leave it to the default value: Standard.
-
Save to file: Check this box. A filename automatically appears; save this location.
-
-
Click Run.
-
Add a list item to a list in your SharePoint team site.
How it works…
SQL Profiler attaches to an instance of your database. It can then interrogate and report on every event that takes place in that database. We need to be aware that Profiler will show activity on all the databases, which includes everything from the social databases to managed metadata to search — a lot of information to collect.
When you first clicked Run in the sixth step, the trace began immediately. You may have noticed how much communication there was between SharePoint 2010 and the SQL Server; even the shortest of traces produces voluminous data.
Here is a sample statement related to a particular timer job:
exec dbo.proc_CompleteTimerRunningJob @ServiceId='168D1873-BC36-4E51-AF85-8E1C7162C389',@VirtualServerId=
'AA272A38-214B-4CE3-8F71-2FC2BC670E7E',@JobId='A6EBD258-6575-45B4-AFB2-A6038345974F',@ServerId=
'C17285C9-27C8-4C88-A989-86B5DFDDA25B',@Status=2,@RequestGuid='9D6166F7-81F7-4813-B3EC-16581C6EBD6B'
It shows the timer job being completed. If the GUID were translated, we would have some powerful information at our disposal, which otherwise may not be possible through Central Administration.&;
There’s more…
There is a second tab called Events, on the definition of a trace shown in step 5 of this recipe. An event is an action generated by SQL Server. Each event is part of a category. By leveraging templates, certain events such as locks and permissions can be grouped. This presents, in a simplified way, the data we have been tracing.