The SharePoint Timer Service is the conductor for all of SharePoint’s automated systems, responsible for everything from workflows to server configuration synchronization to e-mail notifications, making it one of the most critical components that sets SharePoint apart from a basic data-driven website. As a matter of fact, the Timer Service is responsible for executing the Health Analyzer rule-checks and for initiating the creation of the Usage and Health Analysis reports discussed previously.
The various responsibilities of the Timer Service are defined as timer jobs, which are typically a set of instructions to carry out, and these timer jobs are deployed to the farm as solutions, not created in Central Admin. Timer jobs can be scoped at the farm level, or they can be scoped specifically to a web application or SharePoint service. Due to this scoping, it is quite possible to see multiple copies of the same timer job configured in the same farm, but with associations to different web applications or services.
Despite the fact that the Timer Service itself is responsible for running most of the other monitoring processes, the timer jobs themselves must be monitored in case one or more of them begins to fail to complete its set of instructions. Depending on the environment, the failure of some timer jobs, such as Outgoing E-mail Alerts, may not pose an immediate problem; but if a timer job responsible for pushing farm configuration changes out to the SharePoint servers begins to fail, the results could be catastrophic for the farm if the issue isn’t dealt with immediately.
Managing Timer Jobs in Central Admin
You can find the timer job definitions in Central Admin by selecting Monitoring ⇒ Timer Job Definitions. On your first visit, you will be shown all the configured timer jobs, and there are pages and pages of them. You can use the top-right View menu of the dialog to filter the contents to a specific web application or SharePoint service if you wish. Once you’ve found the timer job you’re looking for, clicking it brings up the configuration and details screen for that timer job. Figure 1 shows the options that can be changed on a timer job.
FIGURE 1
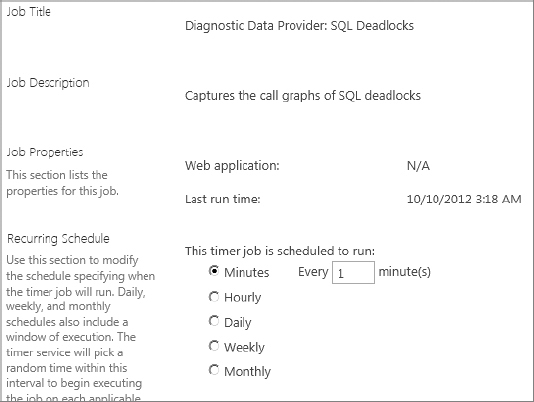
The “Last run time” information is quite valuable, as it tells you whether the job is actually being executed according to its schedule. You can use the schedule options to change the execution schedule for timer jobs, but make sure that you are aware of both the impact that changing the schedule may have on the farm’s resources and any requirements that SharePoint or other systems may have in terms of when or how often the jobs run.
The Run Now and Disable buttons were important changes related to timer jobs introduced with SharePoint 2010. Prior to SharePoint 2010, both manually executing and disabling a timer job required writing code that would make calls against the SharePoint API. Now that these functions are available directly, you can disable a timer job before a potentially destructive change, or you can manually run a timer job immediately after deploying new code, or any number of other scenarios.
Aside from the timer job definitions and the timer job details, you will find four additional Timer Links:
- Timer Job Status
- Scheduled Jobs
- Running Jobs
- Job History
As per their names, the last three pages show lists of upcoming jobs to be run, currently running jobs, and recently completed jobs, respectively. The View menu can be used to filter these lists not only by service and web application, but also by the server on which the job is to be executed, or by the job definition. Take a quick hop back to the first link, Timer Job Status. Figure 2 is a single-page summary of the three status pages you just looked at.
FIGURE 2
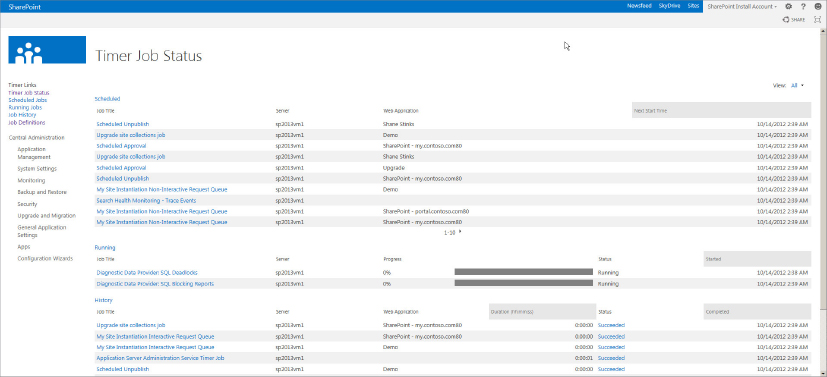
One easy-to-miss detail on both the Job History and Timer Job Status pages is that the job status is a clickable link. Clicking this link not only takes you to a job history list filtered by the status value you clicked (success, failure, etc.), but also provides details about the error encountered if the job failed. This is a great way to start troubleshooting a failed timer job.
Managing Timer Jobs in PowerShell
Several very useful, if not particularly deep, cmdlets are available for working with timer jobs in PowerShell. The basic cmdlet to retrieve timer job entries is Get-SPTimerJob. This will return all timer jobs configured in the farm, so it is wise to do a bit of filtering to only retrieve the job or jobs with which you wish to work. This alone exposes a great deal of information about the timer job(s).
After retrieving the timer job, you can then disable it with Disable-SPTimerJob, enable it with Enable-SPTimerJob, manually launch it with Start-SPTimerJob, or change its schedule with Set-SPTimerJob.
One handy way to use these cmdlets is to manipulate the Health Analyzer Rules, which run at different intervals — some hourly, some daily, some weekly, and some monthly. Some might even run completely randomly, but there’s no proof of that. Because of these intervals, Health Analyzer Rule warnings show up at various times after SharePoint 2013 has been installed. You can use PowerShell to sift through all the timer jobs, pick out the ones that execute the Health Analyzer Rules, and run them all at once. It looks like the following:
Get-SPTimerJob | Where-Object { $_.name -like "*health-analysis*" } | Start
-SPTimerJob
The preceding example gets all the timer jobs in the farm, filters out the ones with “health-analysis” in their name, and then starts each of them. Don’t worry if you don’t understand the exact syntax of that PowerShell command.
If you go back to the Timer Job Status page, you’ll see a whole slew of new running timer jobs in the list, and with any luck in a few minutes you’ll have the familiar red or yellow bar welcoming you at the top of your SharePoint Central Admin page.