By now it should be fairly obvious that SharePoint is capable of collecting a very large amount of information about how it is running. However, we’re about to tumble down the rabbit hole and see just how broad its data collection capabilities truly are. The Usage and Health Data Collection system not only provides basic SharePoint information such as web app statistics, feature use, and page requests within the scope of its reporting umbrella, but also extends its reach to InfoPath, the State Service, the Windows Event Log, and even SQL Server performance.
Collecting large quantities of data can potentially have a very significant performance impact on the farm, but fortunately you can enable, disable, and schedule each data category individually. This enables the collection to be distributed across low-usage times and restricted to only the data you want, minimizing the impact to the farm.
It’s great to have a lot of data; but if it were stored in log files only, then trying to extract any kind of useful information from the data set would be unwieldy and frustrating at best. Thankfully, the Usage and Health Data Collection system is capable of aggregating all the collected information into a SQL Server database. Microsoft has explicitly stated that SharePoint databases should never be directly queried or edited. As the saying goes, however, there’s an exception to every rule, and this database is the exception to that rule. It exists solely to allow administrators to query performance and usage data about the farm in order to generate their own reports. How do you configure this amazing database? What is the name of this rule-breaking, renegade database? You’ll plumb all these mysteries and plenty more in this section.
Configuring Usage and Health Data Collection
Like many parts of SharePoint, the Usage and Health Data Collection settings can be modified both in the Central Admin UI and with PowerShell. Each place has things it does better than the other. The following sections cover the options you have with both approaches.
Configuration in Central Admin
Configuration of the Usage and Health data collection process is handled, conveniently enough, on the Configure Usage and Health Data Collection page under the Monitoring section of Central Admin. The first option available is “Enable usage data collection.” Despite its name, this is actually only the first step in enabling usage data collection. It is not fully functional until a timer job that handles the collection is changed from its default state of Disabled, but that is discussed shortly. Figure 1 shows some of the events you can log.
FIGURE 1
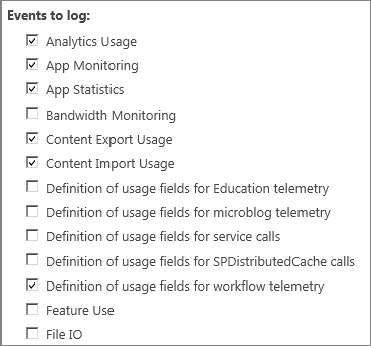
Immediately following the Enable/Disable option is a large block of check boxes for selecting which events should be logged as part of the usage data collection. Again, some of these options can result in a large performance impact on the farm, so only enable the options you truly need. For instance, if your environment seems slow, the SQL IO Usage and SQL Latency Usage options could provide valuable information. If you need to see which features are being used at what times, you can enable the Feature Use option.
Next is a field titled Log File Location, which you might notice is the same location as the default path set for the ULS logs. This is the location where SharePoint stores the collected usage data; and, as with the ULS logs, the specified location must match on all SharePoint servers in the farm. Also like the ULS log, it’s a good idea to move this to a drive other than your Windows system drive. You don’t want Windows and SharePoint fighting for IOPS on that drive. Even worse, you don’t want SharePoint filling it up. SharePoint 2013 differs from SharePoint 2010 in that there was previously a field where you could specify, in GB, the maximum space to be utilized by the logs. However, you can still use PowerShell to modify the value from its default of 5GB.
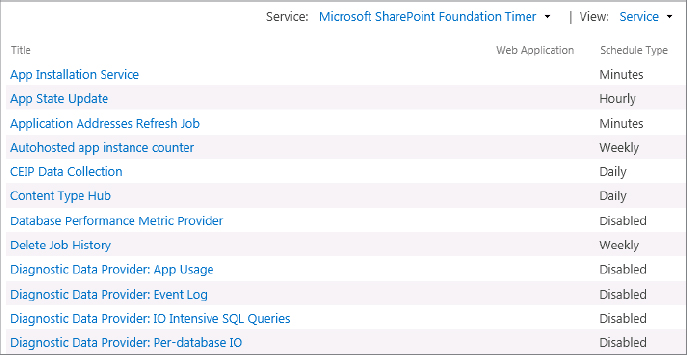
The second function of this service is health data collection. Unlike the usage collection, which gathers information about how various functions are being used, the health data collection periodically captures information about lower-level resources such as blocking reports or deadlocks in SQL Server, timer service-recycling, password management, and much more. You can configure the data collection schedule for each of the gathering categories by clicking Health Logging Schedule. Note that the health logging collection processes are really nothing more than SharePoint timer jobs; and like any other timer job, you can enable, disable, or set a custom schedule for these. Figure 2 shows some of the timer jobs that can be changed.
FIGURE 2
Configuration with PowerShell
As with ULS, some elements of Usage and Health data collection can also be configured via PowerShell, and in fact a few are only accessible through PowerShell. The cmdlet Get-SPUsageService will return information roughly equivalent to the Usage Data Collection and Health Data Collection sections in Central Admin. Of note in the output are two values that are absent from the Central Admin page: UsageLogMaxSpaceGB and UsageLogCutTime. Recall that UsageLogMaxSpaceGB is the value that was accessible through Central Admin in SharePoint 2010 but is hidden in SharePoint 2013, although the default value is still unchanged, at 5GB. UsageLogCutTime specifies how long SharePoint will use the current usage log file before it rotates to a new file. Its default value of five minutes coincides with the log collection import time cycle (covered later), but you can change that. In fact, if the log collection import cycle is increased to an hour or longer, changing UsageLogCutTime to match might result in log files large enough to slow SharePoint down.
You can set UsageLogMaxSpaceGB and UsageLogCutTime, as well as LoggingEnabled and UsageLogLocation, by passing them to the Set-SPUsageService cmdlet.
Log Collection and Processing
The settings thus far have all been related to how each individual SharePoint server handles the collection of its own log data. However, one of the greatest benefits of the Usage and Health data collection service is that it can aggregate the logging information of all the servers in a farm into a single SQL database, and generate reports based on that data. Once again, you can pick your weapon of choice, either Central Admin or PowerShell to change these settings.
Configuration with Central Admin
The final group of options on the “Configure usage and health data collection” page is for the log collection schedule and the logging database configuration.
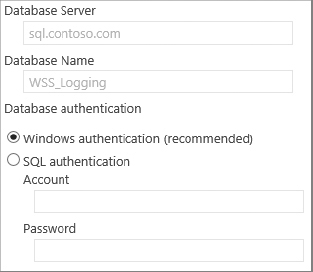
This section looks at the Logging Database Server options first, as they must be properly configured for the log collection to work. Depending on whether or not this service was set up previously, you may find that the Database Server and Database Name fields are disabled, preventing you from editing them. If so, then it is because either the “Enable usage data collection” or the “Enable health data collection” boxes (or both) are checked. When either of these functions is enabled, the service assumes it can use the configured values for the logging database, thus it prevents you from changing them. If you wish to change either the database server or the logging database name, you need to disable both usage and health data collection, change the values, and then enable the collection again. SharePoint will then begin using the newly configured values for all log collection.
FIGURE 3
Returning to the Log Collection Schedule section, click the Log Collection Schedule link to access the Timer Job Configuration page, which is filtered down to just two timer jobs: the Microsoft SharePoint Foundation Usage job for Data Import, and for Data Processing. Figure 4 shows the two timer jobs as they appear in Central Admin. The Data Import timer job is responsible for collecting the log data stored on each server and merging it into the logging database. In order to prevent massive import jobs that can degrade server performance, the Data Import job is configured to run at a five-minute interval, which prevents the quantity of not yet imported data from getting too large.
FIGURE 4
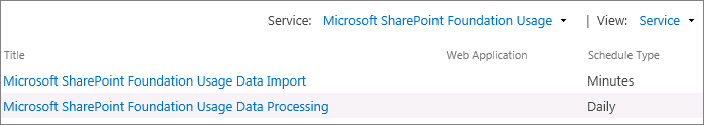
The Data Processing timer job’s role is to process the data that has been imported to the logging database throughout the day and generate meaningful reports from it. By default, the timer job is configured to run between 1:00 AM and 3:00 AM, but it also defaults to a disabled state. Therefore, unless you manually enable the timer job, the log data will only be collected in the database; no reports will be generated from it.
Configuration with PowerShell
The enabled/disabled status of logging and the name of the logging database can be retrieved with the cmdlet Get-SPUsageApplication, but in most cases the rest of the information returned is of little use. You can change the logging database server, database name, database login user name, and (if necessary) the database login password with the Set-SPUsageApplication cmdlet. One advantage to changing this information with PowerShell, rather than in Central Admin, is that the change can be made without having to disable the usage and health data collection first! Plus changing it in PowerShell is just cooler than in Central Admin, so you get that added feeling of superiority over people that don’t do it in PowerShell.