5. Code Profiler Tool
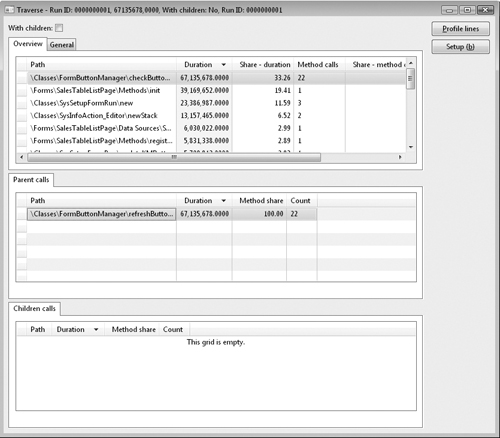
The Code Profiler tool in Dynamics AX 2009 calculates the profile much faster, and it includes a new view of the code profile, providing a better user experience. Figure 7 shows the traverse view, in which each of the called methods in the profiled scenario appears in the top grid. The view also displays a duration count that shows the number of ticks that it took to execute the method and a method count that shows the number of times the methods have been called. The grid for parent calls and children calls shows the methods that called the specific method and the other methods calling the specific method, respectively.
Figure 7. Traverse view in the Code Profiler
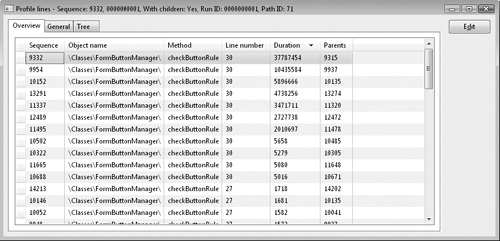
If you use the Code Profiler as a performance optimization tool, you can focus on the methods with the longest duration to optimize the internal structure of the method, or you can focus on the methods called the most and try to limit the number of calls to those methods. You can inspect the internal operation of the methods by clicking the Profile Lines button, which opens the view shown in Figure 8. This view shows the duration of every line in the method.
Figure 8. Profile Lines view in the Code Profiler
The Code Profiler is a powerful tool for finding issues such as problem areas in the X++ code, code that doesn’t have to be executed in certain scenarios, and code that makes multiple calls to the same methods.
Dynamics AX 2009 Monitoring Tools (part 1) – Tracing Options and Other Tracing Activities
Dynamics AX 2009 Monitoring Tools (part 2) – Monitoring Database Activity